Analysis EUR/USD 5M
The EUR/USD currency pair plunged again on Wednesday but recovered in the second half of the day, offering hope for a brighter future. Yesterday, the US dollar rose again on an unjustified basis, as the slightly higher US CPI reading does not change the Federal Reserve's policy outlook through year-end. September inflation exceeded forecasts by only 0.1%, which is not a large deviation. Yet the market reacted as if there had been no FOMC speeches in the past two weeks — most of which said inflation should slow next year and that only one more tightening is likely. By evening and overnight, the euro recovered about 120 pips. That rally, which occurred without an obvious reason, gives the euro hope. First, the descending trendline has been broken after a month-long decline. Second, a sharp and strong euro advance without fundamental reasons likely means traders began taking profits on short positions. If so, new dollar buying should subside in the near term, and the euro can expect the recovery to continue.
Technically, the downtrend may be over, since the trendline has been breached. The market bought the dollar for five consecutive weeks on any pretext, but every story ends. The euro is now steering toward the Senkou Span B line. We believe price must clear that line to start a sustained uptrend.
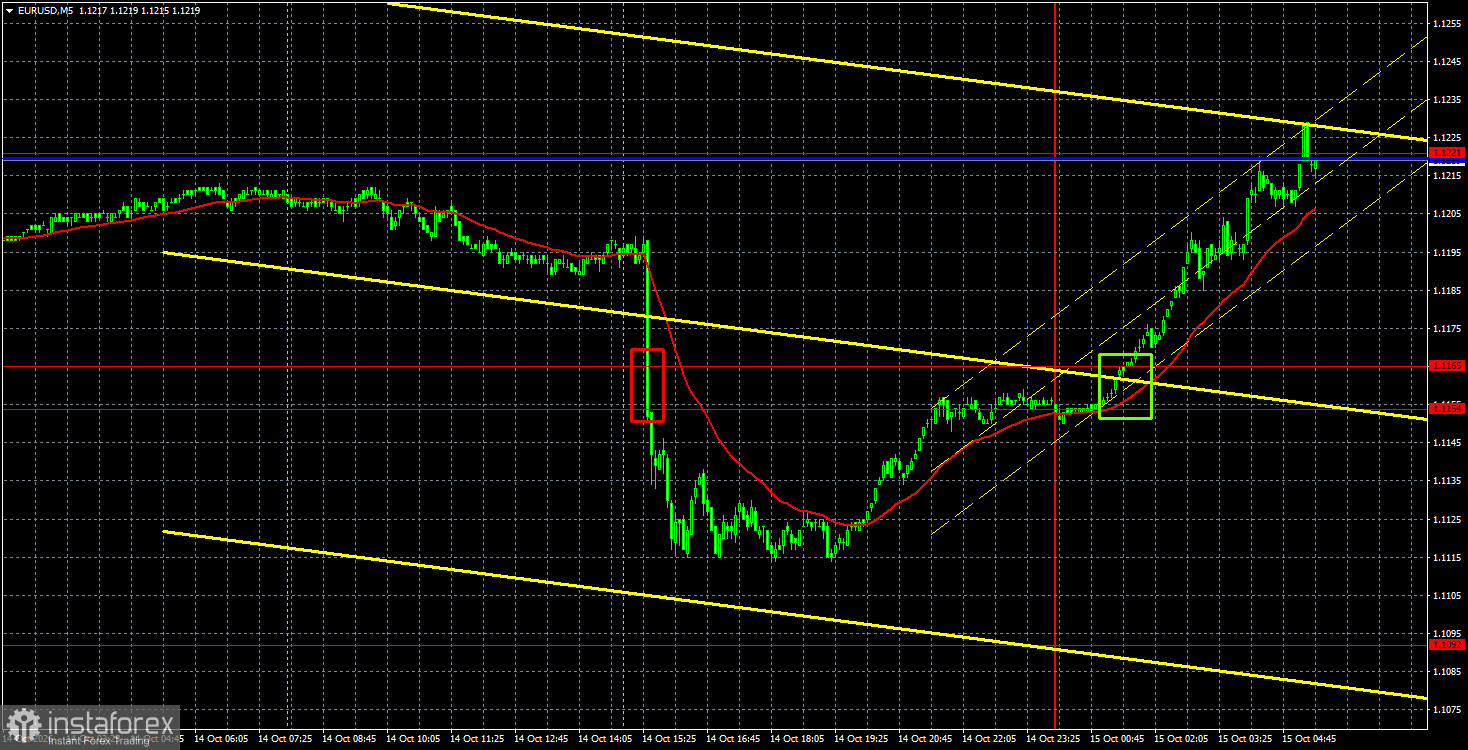
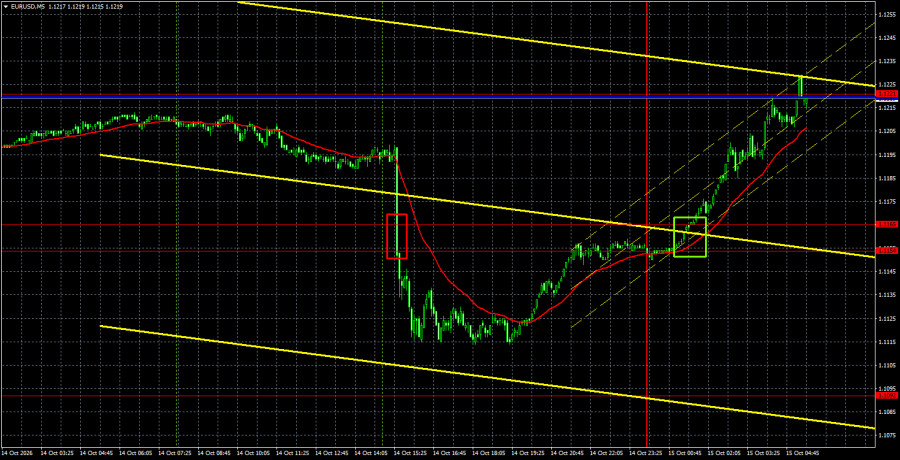
On the 5-minute timeframe, two trading signals formed on Wednesday. The first sell signal did not yield profit for traders, but the second allowed traders to open long positions that could have been closed for profit. Nevertheless, the pair's rise may continue today, so we would not rush to close longs.
COT Report
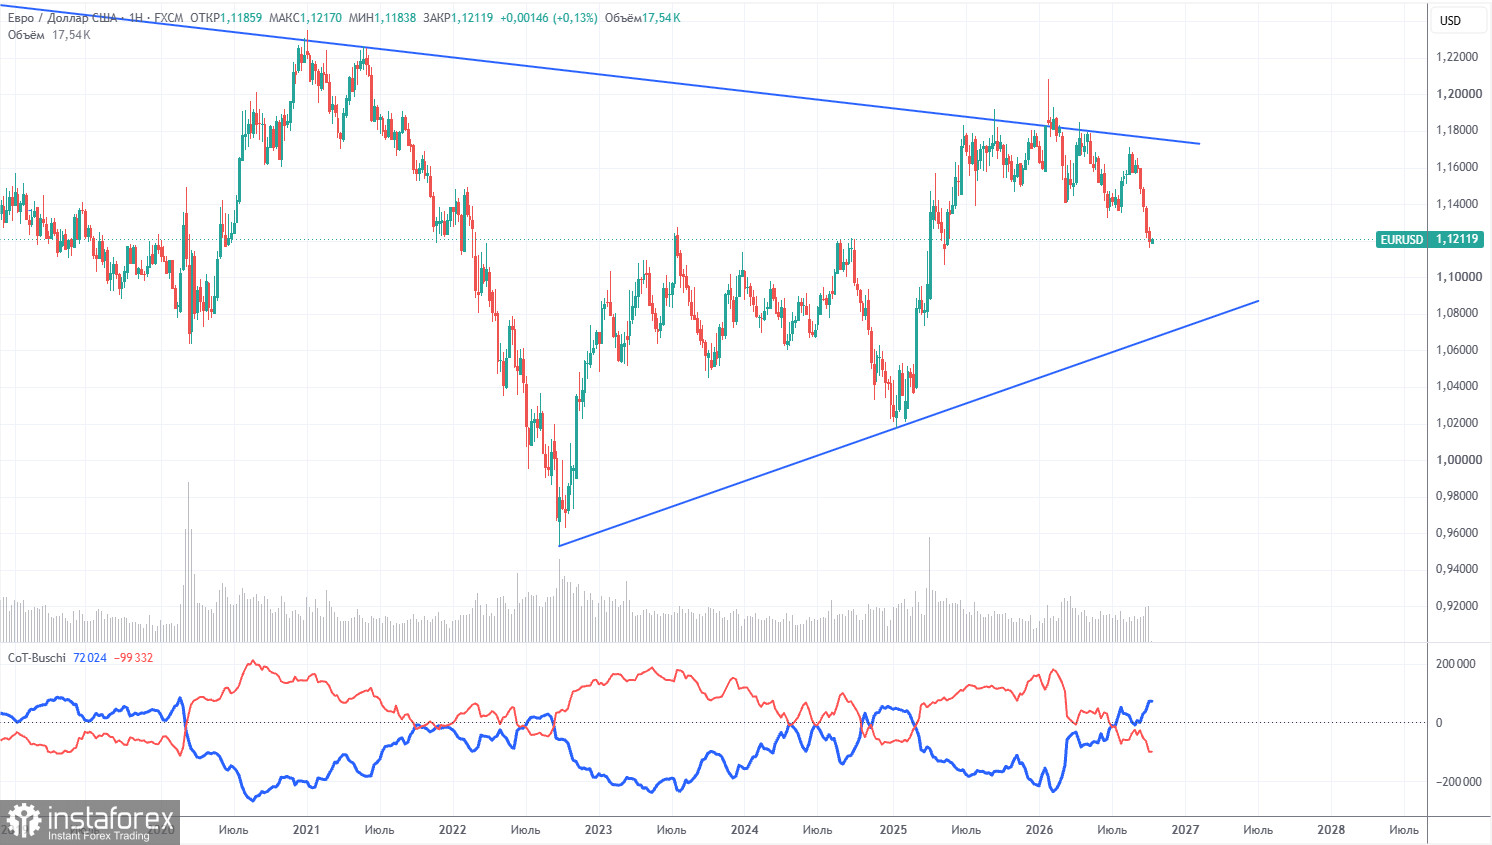
The latest COT report is dated October 6. The weekly timeframe illustration clearly shows that the net position of non-commercial traders remains "bearish" and has declined significantly in 2026 due to geopolitical events. Traders have been reducing euro exposure in favor of the US dollar over the past six months. Trump's policies have not changed, but the dollar has long served as a "reserve" currency.
However, we still do not see any fundamental factors that would further strengthen the US currency. The war in the Middle East made the dollar temporarily super-attractive, and the Federal Reserve's monetary policy stance surprised the dollar for the second time this year. In the long term, the euro could fall as low as $1.08 (the trendline), but the uptrend will remain relevant. Yet in recent weeks the market accounts only for positive factors for the dollar and ignores everything else.
The positioning of the red and blue indicator lines points to an approximate parity between bulls and bears. During the last reporting week, long positions in the "Non-commercial" group increased by 4,800, while shorts rose by 40,900. Accordingly, the net position decreased further by 36,100 contracts over the week.
Analysis EUR/USD 1H
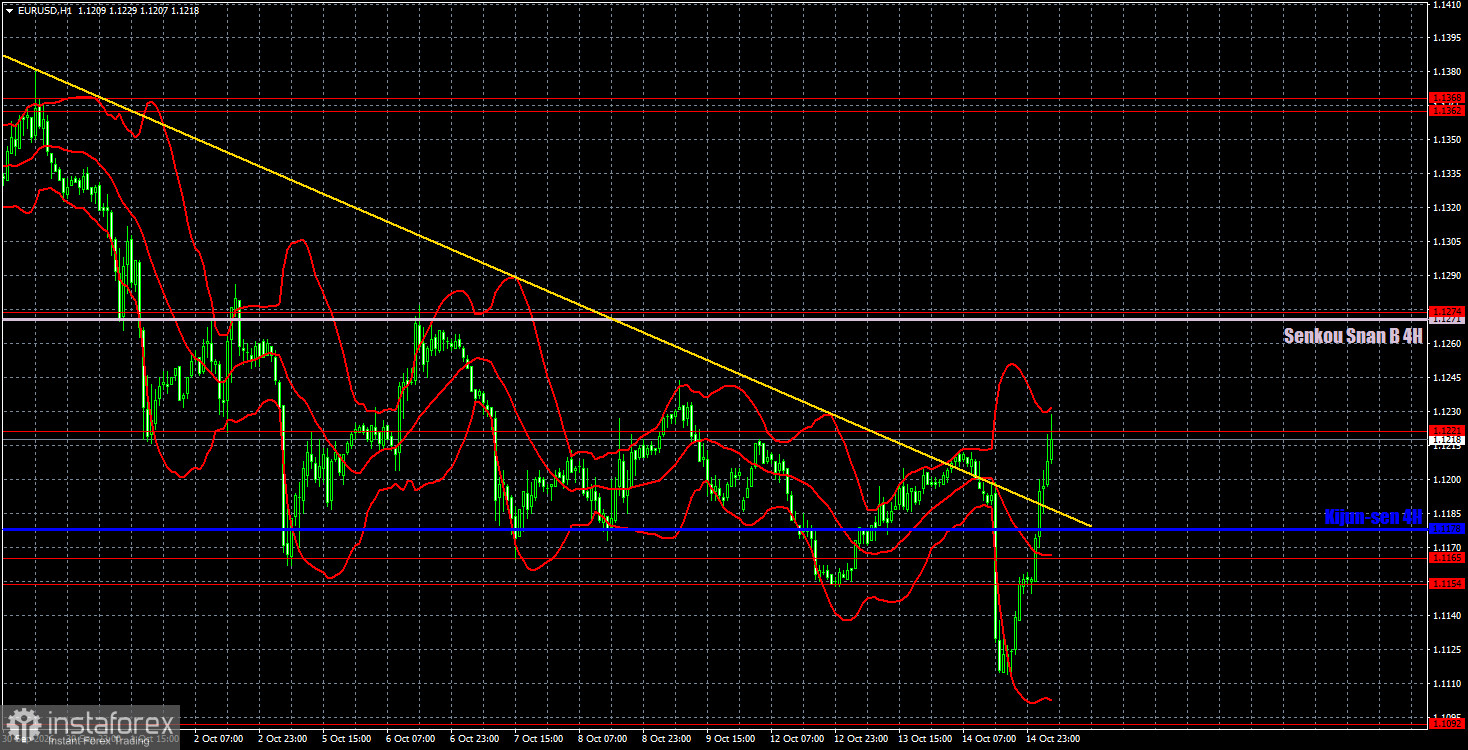
On the hourly timeframe, the EUR/USD pair finally has the opportunity to form an uptrend. On the daily and weekly timeframes, the odds of a strong, lasting trend remain high. Throughout 2026, the dollar was aided by "black swans" that arrived in the market almost in flocks. However, any long-term rise in the dollar is a correction. Perhaps that correction is now complete?
For October 15 we highlight the following levels for trading — 1.1092, 1.1154–1.1165, 1.1221, 1.1274, 1.1362–1.1368, 1.1461–1.1473, 1.1536–1.1542, 1.1585, 1.1657–1.1665, as well as Senkou Span B (1.1178) and Kijun-sen (1.1271). The Ichimoku lines may shift during the day, so account for this when defining trading signals. Don't forget to move your Stop Loss to breakeven once price has moved 15 pips in the correct direction. This will protect against potential losses if the signal proves false.
On Thursday, the Eurozone will publish industrial-production data, which is of little interest. In the US, the Producer Price Index and Retail Sales — somewhat more interesting — will be released today. However, if the market has begun taking profits on shorts, the euro's rise will continue regardless.
Summary of the above analysis:
Traders may target shorts near 1.1221 and 1.1178 if price rebounds from the 1.1271–1.1274 area. If price breaks above 1.1221 and 1.1274, you can maintain longs and target 1.1362–1.1368.
Explanations for the illustrations:
- Price support and resistance levels (resistance/support) — thick red lines around which movement may end. They are not sources of trading signals.
- Kijun-sen and Senkou Span B lines — Ichimoku indicator lines transferred to the hourly timeframe from the 4-hour timeframe. They are strong lines.
- Extreme levels — thin red lines from which the price previously bounced. They are sources of trading signals.
- Yellow lines — trendlines, trend channels, and any other technical patterns.
- Indicator 1 on the COT charts — the size of the net position of each trader category.