

empty
15.10.2026 09:34 AM
Hot US Inflation Triggered Nearly $1B of Liquidations

Bitcoin, Ether, and other altcoins plunged after yesterday's US inflation data. Bitcoin fell below $81,000 and touched the $80,200 area during the decline; Ether lost about 6.5% and trades near $2,350; Solana and XRP fell about 5%. Liquidations over the 24-hour period, according to CoinGlass, totaled roughly $951 million, with about $876 million in long positions — the blow hit leveraged buyers.

This image is no longer relevant

The reason is the numbers. Headline CPI for September rose 0.6% month-on-month after 0.4% in August, and annual inflation accelerated to 3.7% from 3.4% in August, versus a 3.6% expectation. Core CPI, excluding food and energy, rose 0.3% month-on-month and 2.6% year-on-year, up from 2.4% in August and below the consensus of 0.2% and 2.5%. This is the highest level of core inflation since June. Energy prices rose 5.2% month-on-month and accounted for more than half of the acceleration; one summary says gasoline jumped 9.1%. By contrast, headline inflation was 3.4% in August and core 2.4%, which the market saw as grounds for a pause. Now the case for a pause has weakened: the energy shock that pressured prices all autumn has finally reached core components.

The market reaction is consistent. Bond yields rose, and Federal Reserve-hike bets returned: the probability of a rate increase at the October 28 meeting, by various estimates, rose from roughly 17–20% to about 23–33%, while December is still priced as the main scenario. Crypto ends up in the risky-asset basket. Ether is falling about twice as fast as Bitcoin: it accounted for roughly $286 million of the liquidations versus $197 million for Bitcoin, even though Ether futures open interest is around $30 billion compared with $52 billion for Bitcoin.

This brings the market back to the recovery conditions traders hoped for: falling, stabilizing yields and renewed inflows into spot ETFs. Neither condition is met, and the hot CPI pushes the first farther out. Last week ETFs already lost about $1.25 billion across three categories, and Ether funds are recording nine consecutive days of outflows.

My base scenario: until the Fed meeting on October 28, the market will trade under pressure, and any bounces will be sold, until yields stabilize. Today's US Producer Price Index for September may amplify or ease the impression left by yesterday's CPI, and the next inflation report is expected on November 10. On the charts, I would treat the first sign of a genuine reversal not as a price bounce but as a halt to rising yields plus at least two days of net inflows into Bitcoin ETFs.

This image is no longer relevant

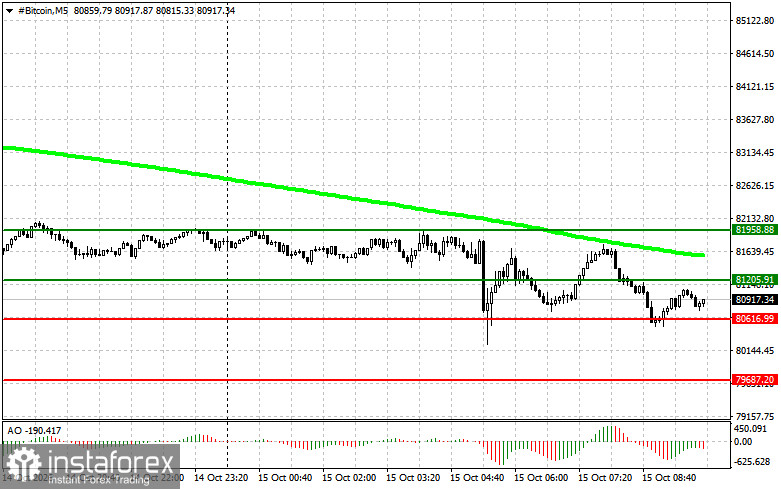
For Bitcoin, the price trades in a narrow range between support at 80,600 and resistance at 81,200, with outer boundaries at 79,600 and 81,900, and the plan centers on two mirror directions: full breakout and rejection scenarios. There are two entries for buying. First, a confirmed breakout above 81,200: buy with a target at 81,900, take profit there, and consider a short on the pullback, provided price is above the 50-day moving average, and the Awesome Oscillator is above zero. Second, a rebound off 80,600 if the downside breakout is unconfirmed and the drop proves false: buy with a return first to 81,200, then to 81,900.

Sales are symmetric. On a confirmed break below 80,600, consider a short position targeting 79,600, provided the moving average is above price and Awesome Oscillator is below zero. If the breakout above 81,200 fails and price returns below the level, short from resistance on a return to 80,600, then to 79,600.

This image is no longer relevant

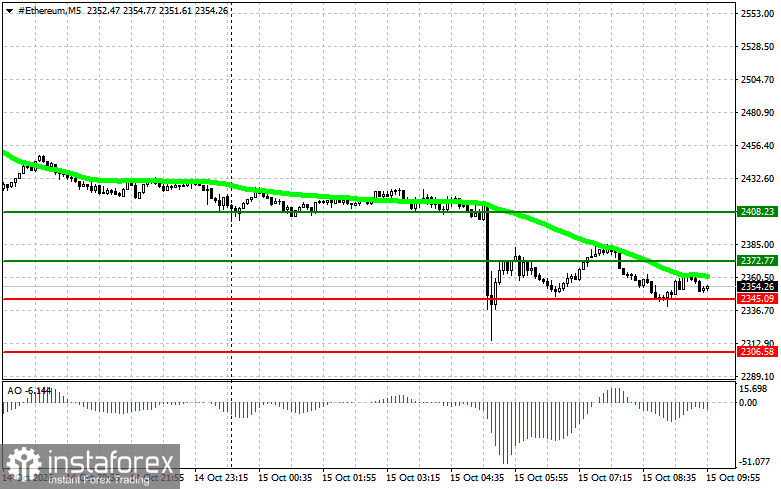
For Ether, the logic fully mirrors Bitcoin on its own price scale: inner range between support 2,345 and resistance 2,372, outer bounds 2,306 and 2,408. Buy on a confirmed breakout above 2,372, targeting 2,408, where I take profit and consider a short on the pullback; the same conditions apply: price above the 50-day moving average and Awesome Oscillator above zero. Buy on a rebound off 2,345; if the downside breakout is unconfirmed, go first to 2,372, then to 2,408.

For selling, a confirmed break below 2,345 opens a short targeting 2,306, provided the moving average is above price and Awesome Oscillator is below zero. A rejection from 2,372, when the upside breakout fails, gives a short with a return to 2,345 and then to 2,306. Both indicators filter out false moves rather than serving as independent reasons to enter early, and decisions are made only after price confirms the specified levels.

EUR
Summary
Neutral
Urgency
1 day
Analytic
Maxim Magdalinin
Start trade
Gana con los cambios en el valor de las criptomonedas con InstaForex.
Descarga MetaTrader 4 y abre tu primera operación.
  • Grand Choice
    Contest by
    InstaForex
    InstaForex always strives to help you
    fulfill your biggest dreams.
    UNIRSE AL CONCURSO
  • Depósito al azar
    ¡Haga un depósito en su cuenta de $3,000 y obtenga $1000 más!
    ¡En Octubre, sorteamos $1000 dentro de la campaña Depósito afortunado!
    Obtenga la oportunidad de ganar depositando $3,000 en una cuenta de operaciones. Tras haber cumplido esta condición, se convertirá en un participante de la campaña.
    UNIRSE AL CONCURSO
  • Opere de forma inteligente, gane un dispositivo
    Recargue su cuenta con al menos $500, regístrese en el concurso y tenga la oportunidad de ganar dispositivos móviles.
    UNIRSE AL CONCURSO
  • 30% de bonificación
    Reciba un bono del 30% cada vez que recargue su cuenta
    OBTENER BONO

Recommended Stories

¿No puede hablar ahora mismo?
Ingrese su pregunta en el chat.
Widget callback