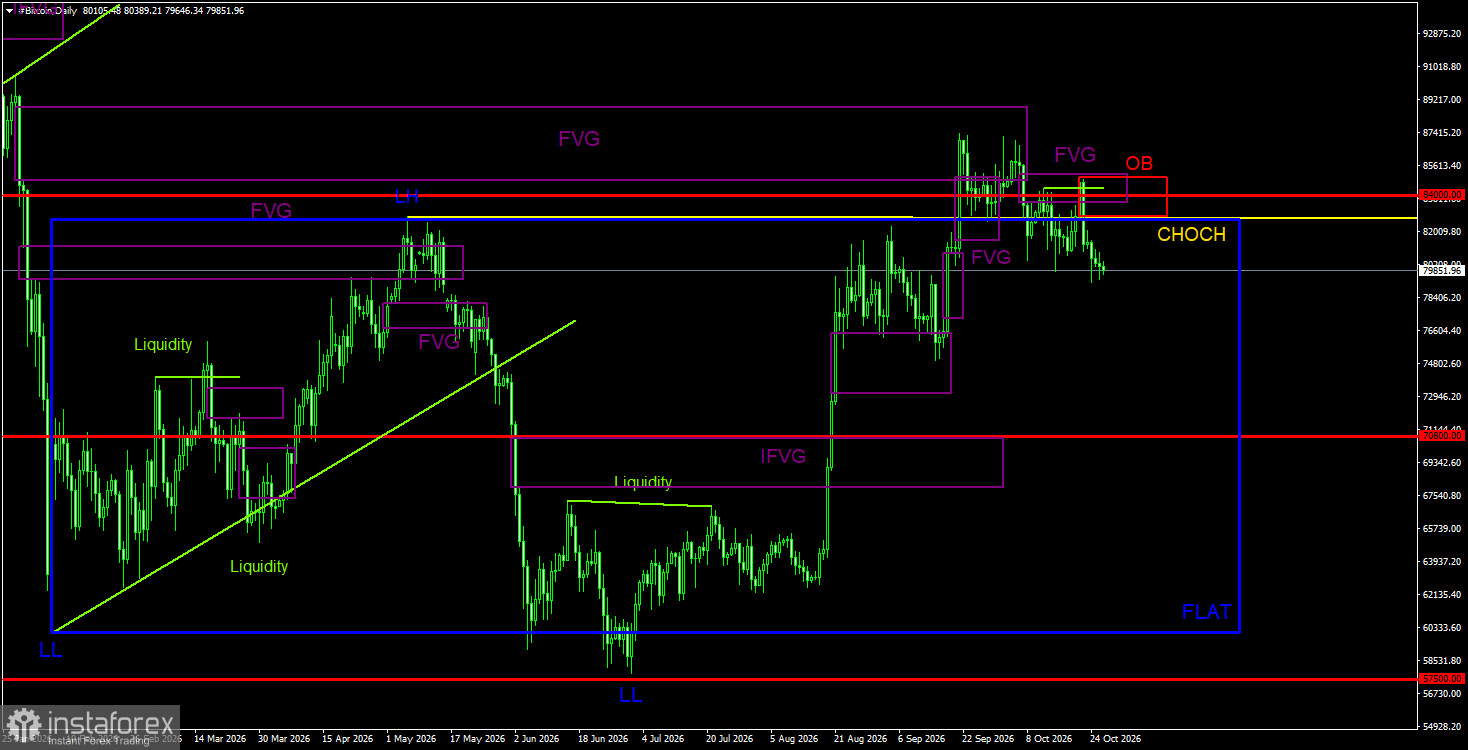
Bitcoin continues a fairly modest decline that could turn into a full-blown crash. For now, the move still looks corrective, but Bitcoin is steadily sliding lower. Recall there is a non-negligible probability the downtrend has already ended. However, the reasons for a new "bull" trend remain ambiguous and debatable. The last three-month rise was essentially a move from the lower boundary of the daily sideways channel to the upper boundary after a deviation formed at the channel's lower edge and then at the upper edge. The upper-edge deviation was deep, but if it is indeed a deviation, Bitcoin could head toward $70,800 in the near term. After that, the price would likely sit inside the flat again, and its prospects would remain uncertain.
Meanwhile, the Federal Reserve meeting is approaching, and Bitcoin is clearly under pressure because of it. U.S. monetary policy remains an important factor for Bitcoin. Remember that Bitcoin, like other risk assets, performs best under "easy" monetary policy or during stimulus programs. In those conditions, borrowing is cheap, the economy grows, and liquidity expands, leaving investors with more money to allocate. If the key rate rises, borrowing becomes more expensive, the economy slows, and liquidity tightens. Therefore, a Fed rate hike is negative for the crypto market — and the Fed is currently set on tightening policy.
Also note that immediately after the U.S. midterms, Donald Trump could resume hostilities with Iran, which might trigger another rally in oil and push inflation higher. In that scenario, the Fed could deliver not two but three or four hikes. We still see no grounds for a sustained bullish trend in Bitcoin.
General Picture of BTC/USD on 1D
On the daily timeframe, the downward trend structure is broken, so most likely "digital gold" has officially moved into forming a new bullish trend. The price worked off the bearish FVG from the previous trend, reacted to that pattern, and a correction began as expected. However, the September breakout beyond the $60,000–$82,500 sideways channel may still be a deviation which, together with the reaction to the bearish FVG, could provoke a drop to the lower boundary of the sideways channel. Another sell signal formed inside the last bearish FVG. In addition, a bearish order block has formed, also pointing south and potentially producing another sell signal.
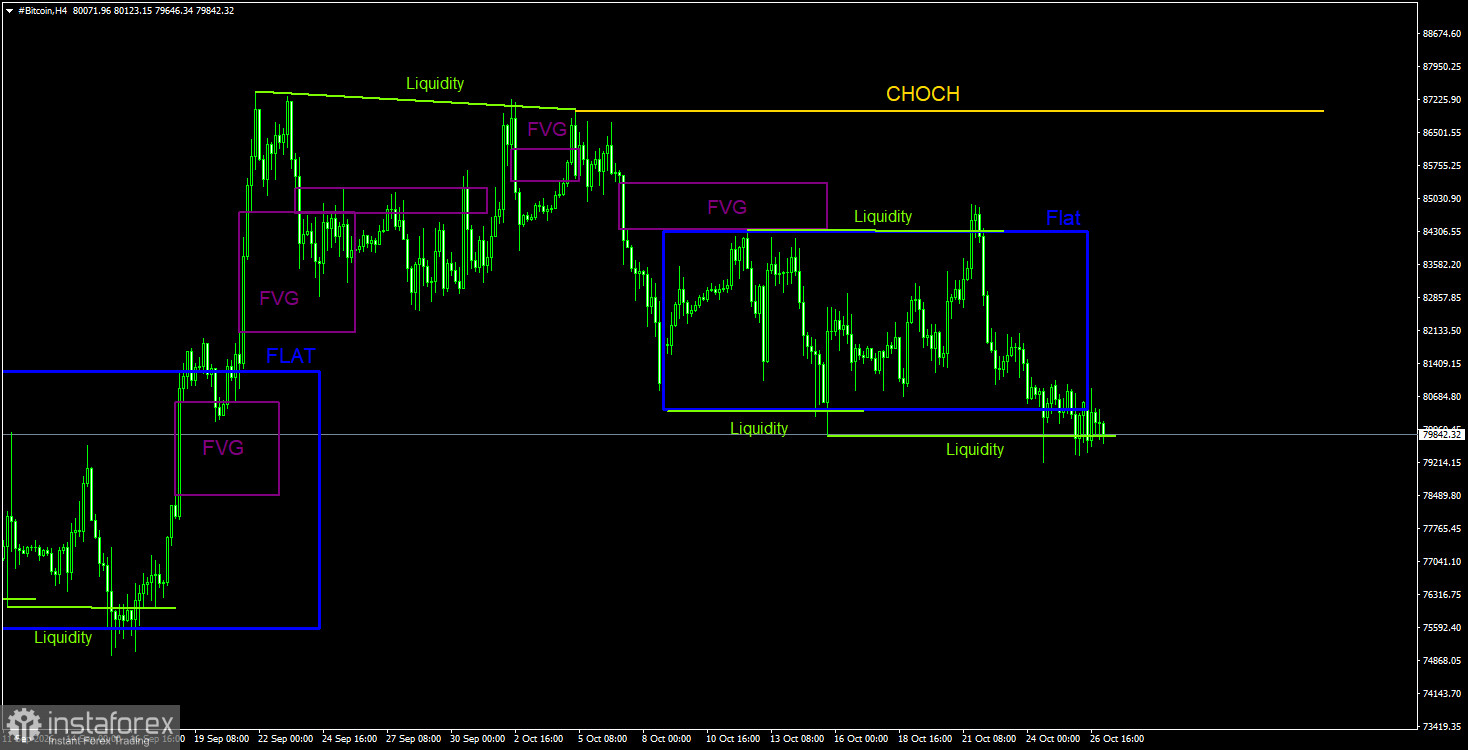
General Picture of BTC/USD on 4H
On the 4-hour timeframe, a downward structure continues to form. The CHOCH line is currently at the $87,000 level. On the daily TF, all necessary downside reversal signals have been received, allowing traders to open short positions. Bitcoin's targets are best determined by the daily sideways channel, which we regard as still relevant. On the 4-hour TF, a flat persists; the upper-boundary deviation of the sideways channel led to a drop to the lower boundary as anticipated. Given the number of bearish patterns and sell signals, we would expect an exit from the sideways channel via the lower boundary and further decline of the leading cryptocurrency. The recent removal of liquidity from the lower boundary did not trigger a sharp rebound, so liquidity at current levels appears absent. In that case, the decline of "digital gold" is likely to continue.
Trading Recommendations for BTC/USD
Bitcoin shows signs of the start of a new bullish trend. As is typical, this trend began with a pump with no clear, specific reason. However, in the near term on the daily TF, Bitcoin may decline because the price reacted to the last two bearish FVGs and formed a bearish order block. Also note that the breakout beyond the daily sideways channel may be a deviation — yes, a deep deviation, but still a deviation. If so, Bitcoin could head toward $70,800 and even maintain the downtrend that began last year. We believe short positions are most relevant in the near term. The deviation near the lower boundary of the sideways channel on the 4-hour TF is not convincing, and a 4-hour breakout would allow the downward move to resume.
Explanations for the illustrations:
CHOCH — Change of Character: a break in trend structure.
Liquidity — Liquidity: stop-losses and pending orders that market-makers use to accumulate positions.
FVG — Fair-Value Gap: a price-inefficiency zone. Price moves quickly through such areas, indicating one side is absent from the market. Subsequently, price often returns and reacts to these areas, continuing the main trend.
IFVG — Inverted Fair-Value Gap: after returning to such a zone, price does not react there but impulsively breaks through it and then tests it from the other side.
OB — Order Block: a candle where a market-maker opened a position with the intent to take liquidity and then establish a position in the opposite direction.